Introduction
Condoms are an everyday consumer product, but the business behind them reflects changing shopping habits, public-health priorities, retail competition and consumer spending.
Americans can purchase condoms from pharmacies, supermarkets, convenience stores and online retailers. They can also choose between established brands, different materials, premium products and lower-priced multipacks.
But is the American condom market growing, or are consumers buying fewer condoms? Which company leads the market? And which US states have the highest and lowest consumption?
The available evidence provides some clear answers—but it also exposes an important data gap. Market revenue, actual product consumption and survey-reported condom use measure different things. Understanding that distinction is essential to interpreting the market correctly.
1. Is the US Condom Market Growing or Declining?
The market outlook is positive in revenue terms, but the evidence on actual consumption is more mixed.
Grand View Research estimated the US condom market at approximately $1.42 billion in 2023 and forecast that it would reach $2.14 billion by 2030, representing a projected compound annual growth rate of 6.1% from 2024 to 2030.
These figures are a commercial research firm’s estimates and forecasts, not government-reported retail sales. Other research providers use different definitions and arrive at substantially different market sizes.
A growing market value does not necessarily mean consumers are buying more individual condoms. Revenue can increase because of higher prices, a shift towards premium products or changes in the categories included in a market estimate.
There is also evidence that consumption growth has slowed at times. In August 2024, Reuters reported that Church & Dwight, the owner of Trojan, said growth in condom-category consumption had slowed from 4.5% to 2% amid pressure on consumers’ spending.
That suggests a more nuanced picture than a simple claim that demand is either booming or collapsing.
What the numbers tell us
| Indicator | What the evidence says |
|---|---|
| Market revenue outlook | One major research forecast projects continued growth |
| Actual consumption | Growth slowed in the period reported by Church & Dwight in 2024 |
| Current national unit sales | A consistent, publicly accessible current series was not verified |
| Long-term demand | Influenced by pricing, shopping access, public health and consumer preferences |
The most defensible conclusion is that the market is forecast to grow in value, while the direction of actual unit consumption cannot be established from revenue forecasts alone.
2. Who Is the Market Leader in the United States?
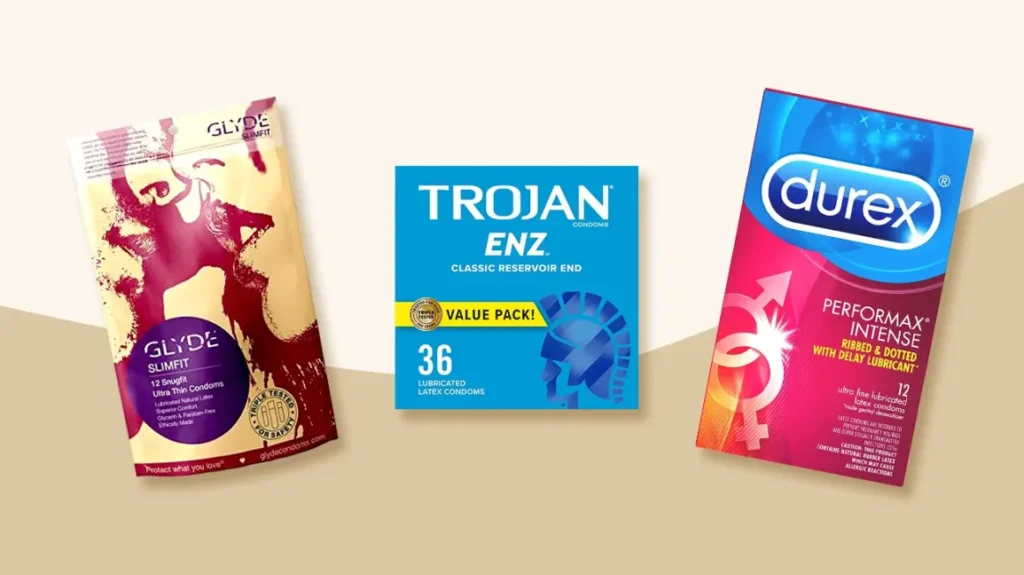
Trojan: The leading US condom brand
Trojan is owned by Church & Dwight, the consumer-products company also known for brands such as Arm & Hammer.
Church & Dwight describes Trojan as the number-one condom brand in the United States. Its business strategy combines broad retail distribution, consumer marketing and a range of product options.
Trojan competes through several product categories, including traditional latex condoms, lubricated products, different textures and non-latex alternatives.
Brand recognition is commercially valuable in a category where customers may prefer a familiar product and retailers need to decide which products deserve shelf space.
However, an exact market-share percentage should be treated carefully unless it is tied to a clearly dated, independently sourced measurement of the relevant retail channel. A brand’s share of pharmacy sales, for example, may not be identical to its share of online sales or the entire market.
Which other brands compete with Trojan?
The US market includes several established competitors.
- Durex: An international condom brand owned by Reckitt.
- SKYN: A prominent non-latex brand associated with LifeStyles Healthcare.
- ONE Condoms: Offers multiple product types and sizes.
- Kimono: A brand associated with Mayer Laboratories.
- Okamoto: A Japanese manufacturer known for condoms and other products.
Competition takes place through price, product design, material, availability, brand trust and consumer preferences.
For shoppers, the biggest brand is not automatically the best choice for every individual. Material compatibility, fit, correct use and the product’s intended purpose matter more than popularity alone.
3. How Americans Shop for Condoms
Condom shopping takes place across both physical and online channels.
Pharmacies and drugstores
Pharmacies remain an important channel because consumers can purchase condoms alongside other personal-care and healthcare products.
They offer convenience, familiar brands and the ability to buy products immediately. Product selection and prices vary by retailer and location.
Supermarkets and mass retailers
Large retailers offer another convenient option, especially for shoppers buying condoms as part of a broader household shopping trip.
Retailers may compete through multipacks, promotions, product availability and shelf placement.
Online shopping
Online retailers offer product comparisons, customer reviews and a wider range of options in some categories. Home delivery can also provide greater privacy for customers who prefer not to purchase these products in person.
However, public market reports do not establish that online sales are necessarily increasing faster than every physical retail channel in the United States. That claim would require comparable, channel-specific sales data.
What influences a purchase?
Condom shopping decisions may depend on:
- Price and the cost per condom.
- Brand familiarity and trust.
- Latex versus non-latex material.
- Fit, comfort and sensitivity.
- Pack size and product availability.
- Delivery speed and privacy.
- Promotions and retailer pricing.
These factors create opportunities for brands to differentiate products rather than compete on price alone.
4. Are Consumers Moving Towards Premium and Non-Latex Condoms?
Product variety is an important part of the category’s commercial strategy.
Latex condoms remain a major segment of the US market. Grand View Research reported that latex products accounted for more than 85% of market revenue in 2023.
Non-latex products provide alternatives for people with latex sensitivities or other preferences. They can also compete on attributes such as comfort and material feel, depending on the product.
Premiumisation can affect the market’s value even when the number of units sold grows slowly. If consumers shift towards more expensive products, average revenue per unit can rise.
That does not prove every consumer is trading up. Price sensitivity, retailer promotions and the availability of lower-cost products remain important.
Shoppers should always check the product label and instructions, especially when selecting condoms for use with lubricants or for a particular purpose. Not every material is compatible with every lubricant, and condoms differ in their approved uses.
5. Which US State Has the Highest Condom Consumption?
This is one of the most frequently asked questions about the category—and one of the hardest to answer accurately.
There is no reliable, current public ranking I could verify that measures total condom units purchased or consumed in every US state.
Retail sales data may be held by commercial market-research providers, retailers and payment or distribution networks. Even when such data exists, it may cover only selected stores or online channels rather than every purchase.
A state with a large population could have high total sales simply because it has more residents. A smaller state could have higher per-capita consumption despite lower total sales.
These are different measures:
- Total consumption: The total number of condoms purchased or used in a state.
- Per-capita consumption: Estimated consumption divided by the population.
- Survey-reported use: The proportion of a defined group reporting condom use.
- Retail sales: Purchases recorded by the retailers or channels covered by the dataset.
They should not be treated as interchangeable.
What does the available state-level research show?
A 2019 Youth Risk Behavior Survey analysis published by the Guttmacher Institute examined condom use at last sex among sexually active high school students.
In that analysis, reported use ranged from 63% in New Jersey to 45% in Ohio among the states compared.
These results concern a specific group of students and a specific survey measure. They do not establish that New Jersey is the highest-consuming state overall or that Ohio has the lowest condom sales today.
The findings are useful for understanding differences in reported behaviour among young people, but they cannot replace a state-by-state retail sales dataset.
6. Which State Has the Lowest Condom Consumption?
For the same reason, it would be misleading to name a definitive lowest-consuming state.
The 2019 student survey identified Ohio as having the lowest reported condom use at last sex among the states compared in that analysis. That is not the same as having the lowest number of condoms sold or used per resident.
A reliable state ranking would need to specify the population, year, data source and measurement method. It would also need to distinguish total sales from per-capita sales and self-reported use.
Without those details, a headline naming a state as the lowest consumer would create a stronger claim than the evidence supports.
7. What Could Drive Future Market Growth?
Several factors could influence the US condom market over the coming years.
Online retail access: Online shopping can expand product selection and provide a convenient alternative to physical stores.
Product innovation: Different materials, sizes, designs and packaging may appeal to consumers looking for products suited to their preferences.
Public-health programmes: Condom availability and education can affect access, particularly among groups facing financial or healthcare barriers.
Price sensitivity: Higher prices can affect purchasing frequency, product selection and demand for multipacks or lower-cost alternatives.
Competition from other contraceptives: Consumers choose among multiple contraceptive methods based on their needs, preferences and medical circumstances. Changes in the use of other methods can affect the role of condoms in pregnancy prevention, although condoms also provide protection against many sexually transmitted infections.
Retail and distribution: Shelf space, stock availability, promotions and distribution agreements can affect which brands consumers encounter.
These factors can influence revenue and unit sales in different directions. A growing market valuation should not be interpreted as proof that condom usage is increasing at the same rate.
8. What This Means for Retailers and Brands
For retailers, the market presents a balance between affordability, choice and availability.
Offering different brands, materials and pack sizes can serve customers with different budgets and preferences. Product descriptions should be clear, and stock management is important for a category where customers may value immediate availability.
For manufacturers, brand trust, distribution, product development and pricing are central competitive factors. They must also maintain quality and comply with applicable product regulations.
For online retailers, privacy, accurate product information, reliable delivery and discreet packaging—where offered—can influence the customer experience.
The opportunity is not simply to sell more products. It is to understand what customers value and make suitable products accessible.
Frequently Asked Questions
Is the US condom market growing?
Commercial market forecasts project growth in revenue. However, actual unit consumption can behave differently, and category consumption growth slowed in the period reported by Church & Dwight in 2024.
What is the size of the US condom market?
Grand View Research estimated the market at approximately $1.42 billion in 2023 and forecast $2.14 billion by 2030. Other providers publish different estimates, depending on methodology and market definition.
Which condom brand is number one in the United States?
Trojan, owned by Church & Dwight, identifies itself as the leading US condom brand. Exact market-share percentages depend on the source, time period and retail channels measured.
Which US state buys the most condoms?
A current, comprehensive public ranking of condom units sold by state could not be verified. Total sales and per-capita consumption would also produce different rankings.
Which state uses condoms the least?
There is no verified current state ranking for overall consumption. A 2019 analysis of sexually active high school students found the lowest reported condom use at last sex among the states compared in Ohio, but this is not a measure of total state consumption.
Are Americans buying more condoms online?
Online shopping provides greater convenience and product choice, but a definitive claim about its current growth relative to physical retail requires comparable channel-specific sales data.
Do higher market revenues mean more condoms are being used?
Not necessarily. Higher prices or a shift towards premium products can increase market revenue even if the number of units sold remains flat or declines.
The Bottom Line
The US condom market has a positive revenue outlook in several commercial forecasts, but the available evidence does not justify a blanket claim that Americans are using more condoms every year.
Trojan is the leading US brand according to its owner, Church & Dwight. Consumers can purchase condoms through pharmacies, mass retailers and online channels, with product variety and price influencing shopping choices.
The state-level question remains less settled. Existing survey research measures particular groups and behaviours, not a comprehensive ranking of condom sales across all states.
For a data-driven picture of the market, the next step would be to obtain a consistent retail dataset that reports units sold and revenue by state, channel and time period.